PySpark Show Dataframe to display and visualize DataFrames in PySpark, the Python API for Apache Spark, which provides a powerful framework for distributed data processing and analysis. One of the key components of PySpark is the DataFrame, which is an organized collection of data organized into named columns. In this article, we will explore various methods to display DataFrames in PySpark.
Table of Contents
Create DataFrame using the employee table
Before diving into displaying DataFrames, let’s first create a DataFrame using the employee table. This table contains information about employees, such as their names, departments, and salaries. We can load the employee table into a DataFrame using PySpark’s built-in functions.
# Define the schema for the employee table
        schema = StructType([
            StructField("employee_id", IntegerType(), True)
            StructField("employee_name", StringType(), True),
            StructField("department", StringType(), True)
        ])

        # Dummy data for the employee table
        data = [
            (1, "John Doe", "Sales"),
            (2, "Jane Smith", "Marketing"),
            (3, "Michael Johnson", "HR"),
            (4, "Mary Williams", "Finance"),
            (5, "David Jones", "IT"),
           (6, "Rajesh", "Sales"),
           (7, "Ramesh", "Marketing"),
           (8, "Suresh", "HR"),
           (9, "Peter", "Finance"),
           (10, "Paul", "IT")

        ]

        # Create a DataFrame from the dummy data and schema
        employee_df = self.spark.createDataFrame(data, schema)
PySpark Show DataFrame: Displaying options
Once we have a DataFrame, we can use various methods to display its contents.
Using the show() method
The show() method is a convenient way to display the contents of a DataFrame. It shows the first 20 rows by default.
employee_df.show()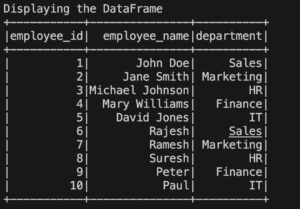
The above code will display the first few rows of the DataFrame.
Displaying specific columns
Sometimes, we may only be interested in certain columns of a DataFrame. We can select specific columns and display them using the select() method followed by the show() method.
employee_df.select("employee_name", "department").show()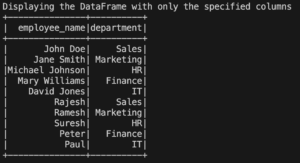
The code above selects the “employee_name”, “department” columns from the DataFrame and displays them.
Exploring DataFrame Contents
Apart from displaying the entire DataFrame or specific columns, we can also explore the contents of a DataFrame in more detail.
PySpark Show DataFrame -Displaying first n rows
To display the first n rows of a DataFrame, we can use the head() method.
employee_df.head(5)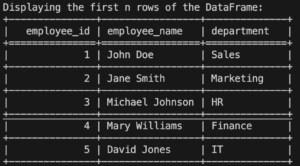
The above code will display the first 5 rows of the DataFrame.
PySpark Show DataFrame-Displaying the last n rows
Similarly, to display the last n rows of a DataFrame, we can use the tail() method.
employee_df.tail(5)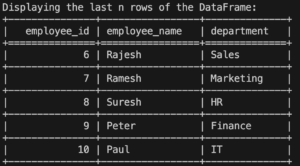
The above code will display the last 5 rows of the DataFrame.
PySpark Show DataFrame-Limiting the number of rows displayed
If we want to limit the number of rows displayed, we can use the limit() method.
employee_df.limit(4).show()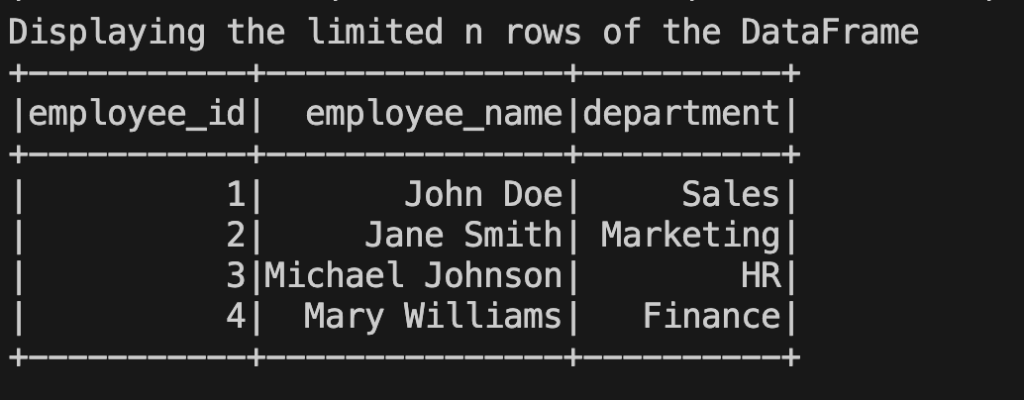
The above code limits the display to the first 10 rows of the DataFrame.
PySpark Show DataFrame-Displaying DataFrame vertically
By default, DataFrames are displayed horizontally, which means that if there are many columns, they may get truncated. However, we can display DataFrames vertically to view all the columns.
employee_df.show(n=10, truncate=False, vertical=True)
The above code displays the first 10 rows of the DataFrame vertically without truncating the columns.
PySpark Show DataFrame- Displaying DataFrame with truncate
On the other hand, if we want to truncate the displayed content to fit within a certain width, we can use the show() method with the truncate parameter set to True.
employee_df.show(n=10, truncate=True)The above code displays the first 10 rows of the DataFrame with truncated content.
PySpark Show DataFrame- Displaying DataFrame with all parameters
PySpark’s show() method provides several parameters to customize the display. We can specify the number of rows to show, truncate column values, display the DataFrame vertically, and more.
employee_df.show(n=10, truncate=True, vertical=True, header=False)The above code displays the first 10 rows of the DataFrame with a maximum column width of 30 characters, in a vertical layout without the header.
PySpark Show DataFrame- Display DataFrame by using toPandas() function
In some cases, it might be useful to convert a PySpark DataFrame to a Pandas DataFrame for easier visualization and analysis. We can achieve this using the toPandas() function.
pandas_df = employee_df.toPandas()
pandas_df.head()
The code above converts the PySpark DataFrame to a Pandas DataFrame, allowing us to use Pandas functions to explore and visualize the data.
Customizing Display Options
PySpark provides options to customize the display of DataFrames according to our preferences.
PySpark Show DataFrame-Adjusting column width
If the column values are too long and get truncated, we can adjust the column width using the option() method.
spark.conf.set("spark.sql.repl.eagerEval.maxNumOfFields", "100")
employee_df.show()
The above code adjusts the maximum number of fields displayed to 100, ensuring that long column values are fully shown.
PySpark Show DataFrame-Truncating cell content
To truncate the content of individual cells in a DataFrame, we can use the withColumn() method along with PySpark’s string manipulation functions.
from pyspark.sql.functions import substring

truncated_df = employee_df.withColumn("truncated_name", substring("name", 1, 10))
truncated_df.show()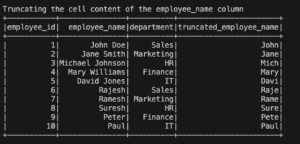
In the above code, we create a new column called “truncated_name” by truncating the “name” column to a length of 10 characters.
The resulting DataFrame, truncated_df, will display the truncated values in the “truncated_name” column.
Summary and Conclusion
In this article, we explored various methods to display and visualize DataFrames in PySpark. We started by creating a DataFrame using the employee table and then discussed different ways to display DataFrame contents. We learned how to use the show() method to display the entire DataFrame or specific columns, as well as techniques to explore the DataFrame’s contents such as displaying the first or last rows, limiting the number of displayed rows, and customizing display options.
By leveraging these techniques, we can effectively present and analyze data in PySpark DataFrames, gaining valuable insights for our data processing and analysis tasks.
FAQs
How can I display a specific column in a PySpark DataFrame?
To display a specific column in a PySpark DataFrame, you can use the select() method followed by the show() method. Here’s an example:
employee_df.select("column_name").show()Replace “column_name” with the name of the column you want to display.
Can I use the display() function to show DataFrame contents?
No, the display() function is not available in PySpark. It is commonly used in other notebooks or platforms like Databricks. In PySpark, we use the show() method to display DataFrame contents.
How do I show all the columns in a PySpark DataFrame?
By default, the show() method displays only a limited number of columns, truncating them if necessary. However, you can adjust the column width to show all the columns. Here’s an example:
spark.conf.set("spark.sql.repl.eagerEval.maxNumOfFields", "100")
employee_df.show()
The above code adjusts the maximum number of fields displayed to 100, ensuring that all columns are fully shown.
Is it possible to limit the number of rows displayed in PySpark?
Yes, you can limit the number of rows displayed in PySpark using the limit() method. Here’s an example:
employee_df.limit(10).show()The above code limits the display to the first 10 rows of the DataFrame.
How can I adjust the column width when displaying a DataFrame?
To adjust the column width when displaying a DataFrame, you can use the option() method to set the desired width. Here’s an example:
spark.conf.set("spark.sql.repl.eagerEval.maxNumOfFields", "100")
employee_df.show()
In the above code, we set the maximum number of fields displayed to 100, ensuring that long column values are fully shown within that width.
These FAQs provide answers to some common questions related to displaying PySpark DataFrames and customizing their display options.
Complete Code:
from pyspark.sql import SparkSession
from pyspark.sql.functions import substring
from pyspark.sql.types import StructType, StructField, StringType, IntegerType
from tabulate import tabulate


class DoWhileLearn:
    def __init__(self):
        self.spark = SparkSession.builder.getOrCreate()
        self.employee_df = self.create_dataframe()


    def create_dataframe(self):
        # Define the schema for the employee table
        schema = StructType([
            StructField("employee_id", IntegerType(), True),
            StructField("employee_name", StringType(), True),
            StructField("department", StringType(), True)
        ])

        # Dummy data for the employee table
        data = [
            (1, "John Doe", "Sales"),
            (2, "Jane Smith", "Marketing"),
            (3, "Michael Johnson", "HR"),
            (4, "Mary Williams", "Finance"),
            (5, "David Jones", "IT"),
           (6, "Rajesh", "Sales"),
           (7, "Ramesh", "Marketing"),
           (8, "Suresh", "HR"),
           (9, "Peter", "Finance"),
           (10, "Paul", "IT")

        ]

        # Create a DataFrame from the dummy data and schema
        df = self.spark.createDataFrame(data, schema)
        return df


    def display_employee_df(self):
        # Display the DataFrame
        print("Displaying the DataFrame")
        self.employee_df.show()

    def display_specific_columns(self, *columns):
        # Display the DataFrame with only the specified columns
        print("Displaying the DataFrame with only the specified columns")
        self.employee_df.select(*columns).show()


    def display_first_n_rows(self, n):
        # Display the first n rows of the DataFrame
        rows = self.employee_df.head(n)
        headers = rows[0].asDict().keys()
        data = [row.asDict().values() for row in rows]

        print("Displaying the first n rows of the DataFrame:")
        print(tabulate(data, headers=headers, tablefmt="grid"))


    def display_last_n_rows(self, n):
        # Display the last n rows of the DataFrame
        rows = self.employee_df.tail(n)
        headers = rows[0].asDict().keys()
        data = [row.asDict().values() for row in rows]

        print("Displaying the last n rows of the DataFrame:")
        print(tabulate(data, headers=headers, tablefmt="grid"))

    def limit_displayed_rows(self, n):
        # Display the first n rows of the DataFrame
        print("Displaying the limited n rows of the DataFrame")
        self.employee_df.limit(n).show()

    def display_dataframe_vertically(self):
        # Display the DataFrame vertically
        print("Displaying the DataFrame vertically")
        self.employee_df.show(n=self.employee_df.count(), truncate=False, vertical=True)

    def display_dataframe_with_truncate(self):
        # Display the DataFrame with truncated columns
        print("Displaying the DataFrame with truncated columns")
        self.employee_df.show(n=self.employee_df.count(), truncate=True)

    def display_dataframe_with_all_parameters(self):
        # Display the DataFrame with all parameters
        print("Displaying the DataFrame with all parameters")
        self.employee_df.show(n=self.employee_df.count(), truncate=True, vertical=True)

    def display_dataframe_as_pandas(self):
        # Display the DataFrame as a Pandas DataFrame
        print("Displaying the DataFrame as a Pandas DataFrame")
        pandas_df = self.employee_df.toPandas()
        print(pandas_df.head())

    def adjust_column_width(self):
        # Adjust the column width
        print("Adjusting the column width")
        self.spark.conf.set("spark.sql.repl.eagerEval.maxNumOfFields", "100")
        self.employee_df.show()

    def truncate_cell_content(self):
        # Truncate the cell content of the employee_name column
        print("Truncating the cell content of the employee_name column")
        truncated_df = self.employee_df.withColumn("truncated_employee_name", substring("employee_name", 1, 4))
        truncated_df.show()

    def run_examples(self):
        self.display_employee_df()
        self.display_specific_columns("employee_name", "department")
        self.display_first_n_rows(5)
        self.display_last_n_rows(5)
        self.limit_displayed_rows(4)
        self.display_dataframe_vertically()
        self.display_dataframe_with_truncate()
        self.display_dataframe_with_all_parameters()
        self.display_dataframe_as_pandas()
        self.adjust_column_width()
        self.truncate_cell_content()

# Instantiate the class and run the examples
learn = DoWhileLearn()
learn.run_examples()